How to keep your models up-to-date?


Pricing actuaries and underwriters strive to create risk models that are accurate and fair. They spend days understanding historical policies and claims data, finding statistical dependencies between policyholders and claims they made, which allows them to create solid rating structures or more advanced pricing models. But building such a model is one thing, keeping it up-to-date as time passes by, is an entirely different struggle.
Except for some specific products and markets, long are gone the times when pricing actuaries or underwriters could update their risk models once a year or so. Most of us are now living in a fast-changing economic environment and we operate on a high-competing insurance market. Making sure our models are up-to-date has never been more important [1], [2].
How to deal with it, and how to make sure our models will be as stable as possible? These are the questions I wanted to tackle below.
To be more specific, in this post, you will find answers (and some tips) to the following questions:
- Why is it so important to keep your models up-to-date?
- How to build longer-lasting risk models?
- How to spot that models are outdated and fix them?
- What’s also crucial in keeping premiums up-to-date?
Why is it so important to keep your models up-to-date?
Outdated risk models mean outdated risk assessment. It means that the amount of premium for a policy is either too low or too high. This means that our newly issued policy is either unprofitable or overpriced, and not aligned with the current risk appetite. One may think that charging too much is harmless since it means more margin for the company, but it is only true if the policy is issued =. In a high-competing market, too high offer leads to loss of the customer – as the price rises, we are simply less likely to convert a quote into a policy. Those two common behaviours lead to decreases in two vital areas of any insurance company’s performance – its solvency and its market share.
Actuaries know best that it is not that easy to recover from unprofitability, because the policies being issued for an inadequate premium are being earned for a year (usually), and for example, for liability insurance policies insurers will experience claims being reported for many more years to come.
Companies with automated pricing updates and shorter time-to-market will spot market changes (such as claims inflation, people’s attitude, and competition) much quicker, and will be able to identify better risk profiles and attract them by offering lower premiums. Guess what will happen to worse risk profiles and who will find them in their portfolio… What’s more, with obsolete pricing it won’t be easy nor quick to spot that the acquired profiles are more risky than it was expected.
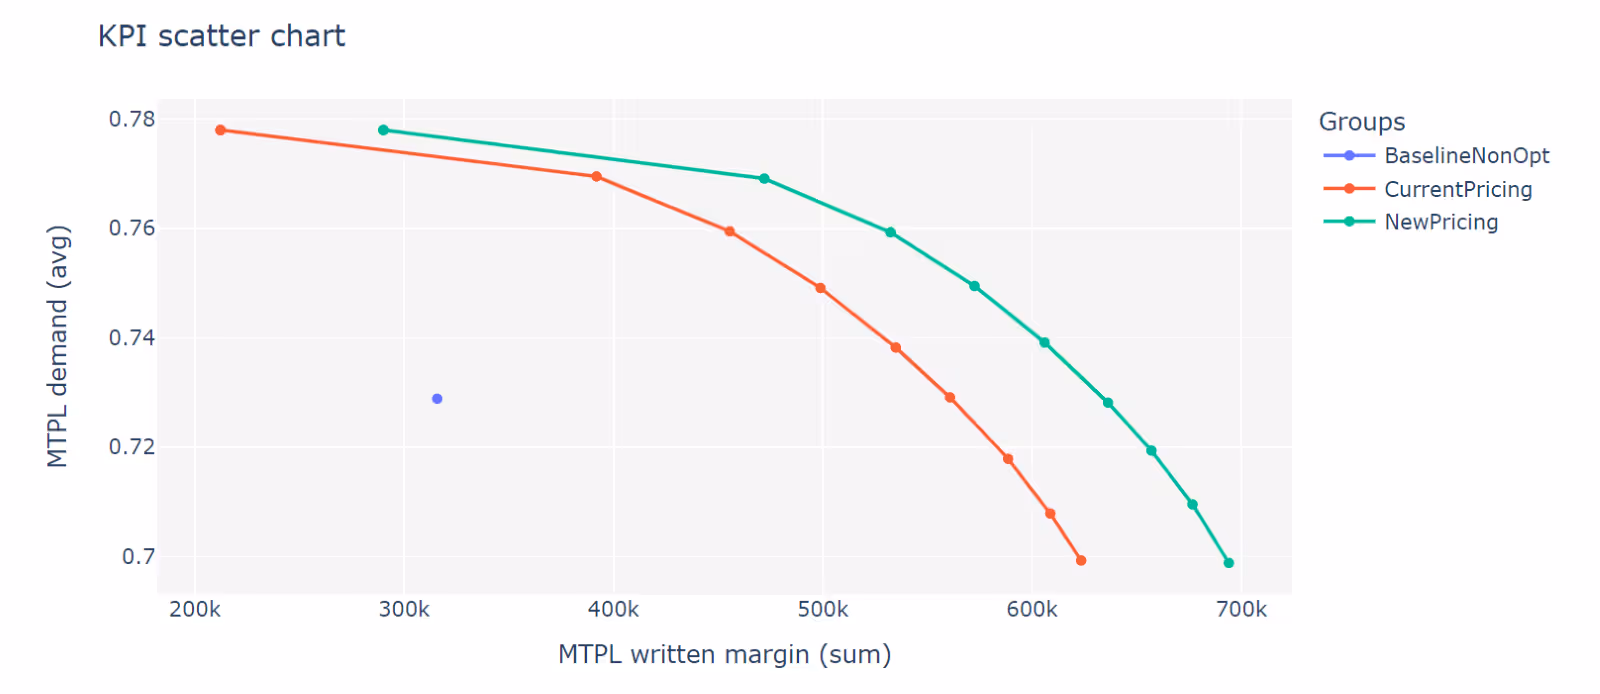
And the situation is even more challenging for demand models (often used for so-called ‘price optimisation’) which lose their relevance much quicker as people’s price elasticity is more dependent on the economic and market situation than their risk profile.
How to build longer-lasting risk models?
First of all, for building risk models, it is crucial to choose the range of policies and claims from several years, which increases our chances of building a well-generalising and time-consistent model. Of course, the older policies and claims we take, the more we need to take care of claims inflation adjustments, include different claims development factors, etc.
The number of years to take depends on the product and the amount of data we have for each underwriting and accident year. Predictive models, especially machine learning ones, need large datasets to achieve stable results.
A reminder: Underwriting Year vs. Accident Year
An underwriting year (UY) is the year of a policy start date, so every policy has always one underwriting year. On the other hand, an accident year (AY) is a year in which a policy offers protection, in which it is being earned, in which accidents to the policy may occur. So, a one-year policy is almost always (except for those started precisely on January 1st) considered in two accident years. An example: a policy lasting from 2023.08.21 until 2024.08.20 is a policy of 2023 UY, lasting in both 2023 and 2024 AY. Why is it important? For risk modelling, we usually want to collect data from several UY and split them into AY. Information about underwriting years helps us, for example, develop claims using different coefficients or analyse our past pricing strategies, while accident years will allow us to adjust past claims to the current level and prepare trending.
Everyone who is building predictive models knows that the goal is not to prepare a model that fits our data best, but the model that will fit as much as possible to new data, to new policyholders.
Training-Validation Split
That’s why it is crucial to use a proper training-validation split on our dataset (usually 70-30, 75-25, or 80-20). Also, it is recommended to use the most recent policies for model validation. Checking whether a model trained on historical data works also on most recent policies, increases the chances that it will also perform well later on production. Those who want to be more certain that their models are not overfitted (not including sample-specific dependencies) and are in possession of a larger amount of data, can explore splitting their datasets into three subsamples – ‘training’, ‘validation’, and ‘test’ (usually 60-20-20 or 70-15-15). And if it is not enough or the amount of data does not allow for leaving data aside from model fitting, cross-validation is preferred.
Cross-validation
Cross-validation is a method in which actuaries split their dataset into several (e.g., 5) evenly distributed subsamples and perform model fitting as many times as one by one each of those subsamples temporarily becomes a validation sample. Then, all results are averaged. So, each of the subsamples is used mostly for model training, but also validation. In this case, it is still good to leave some subsample out of the procedure and save it for final tests (again, most recent data recommended).
Regularisation
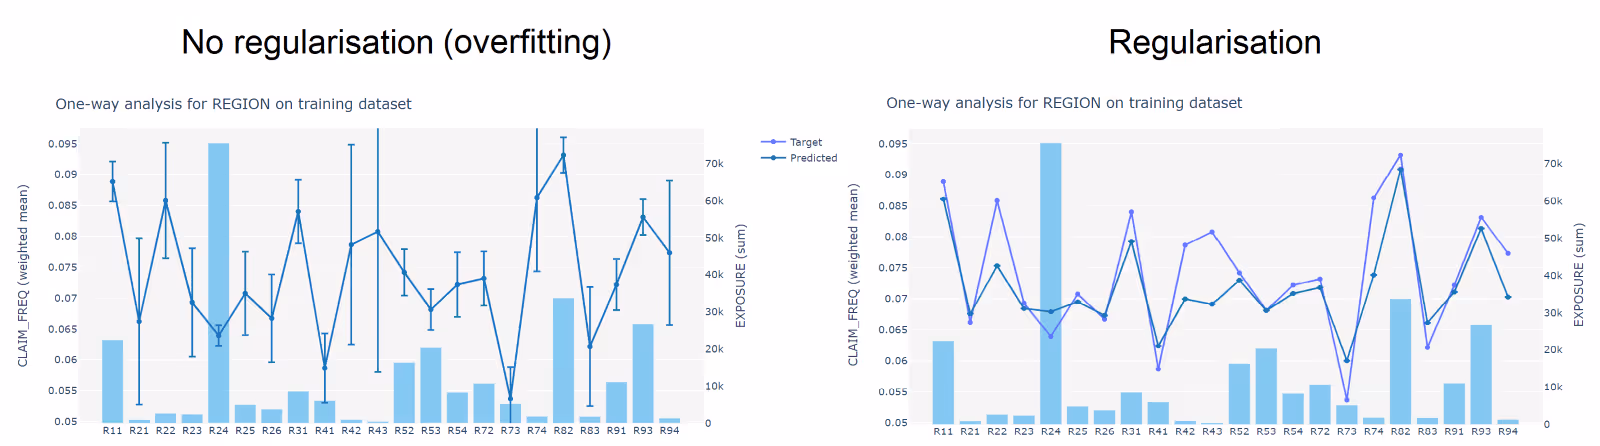
To ensure the credibility of risk models, one may also apply regularisation which is a penalisation based on the famous Lasso or Ridge Regression methods. The idea here is that we don’t believe that the target values for portfolio segments with low exposure reflect the population, so we adjust predictions so that they are closer to the global average. It will probably reduce the goodness-of-fit on your training sample but should increase it where it matters so for new data on production.
Trending
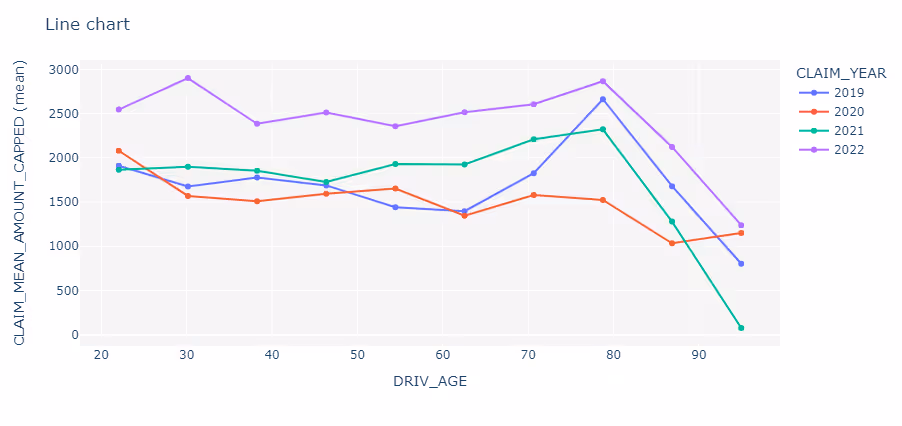
Having information from several years, pricing actuaries can find trends that can be extrapolated in the future. Mentioned was above the idea of accident years, but for trending we can also use accident half years or quarters. It’s up to pricing actuaries and the amount of data. However, by splitting policies into more granular periods than years, one should make sure that their models are not affected by seasonality.
So basically, here we are speaking about time-series modelling and the forecast theory, which is not a typical aspect of the actuarial pricing field. But hey, since we build models on historical data, validate them with the most recent ones, and strive for making them fit also for future policies, we cannot avoid this topic. Usually, we are not considering typical time-series methods, such as ARIMA. In most cases, it is just a simple trend recognition or relying on some inflation forecasts made by leading financial or consulting entities. Seasonality is also usually not the case, since most policies last a whole year. Still, one may include a long-term, multiyear seasonality if they observe it.
Other tips on building well-predicting GLM/GAM models can be found in this post.
How to spot that models are outdated and fix them?
The answer is pretty simple – model monitoring. Pricing actuaries should have a frequent process of their models’ evaluation. Month after month new data should be uploaded and all models should be checked. How to tell whether the model is yet outdated or still up-to-date?
Such model monitoring can be also automated. The best solution is to have the whole pricing process handled in one place, by one tool, and well-automated. In Quantee, we recommend our customers setting up a separate monitoring pipeline.
New data can be uploaded automatically from an SQL database or a cloud, e.g., once a month. Then, the whole process can be recalculated, presenting the final step which is a dashboard with portfolio segments in which drifts are observed, in which our model is outdated.
A reminder: Drift
A drift is a term used to describe a situation in which the performance of our models in production gets worse over time. It can happen, for instance, when the distribution of input data or the relationship between target and explanatory variables changes over time. We observe it on charts when predictions from an initially well-fitted model significantly diverges from observed values as new data are provided.
We can go even further and set up a notification when such a drift is detected by our software. Such automated e-mail may contain the full information and even pictures from the dashboard, where the drift was spotted.
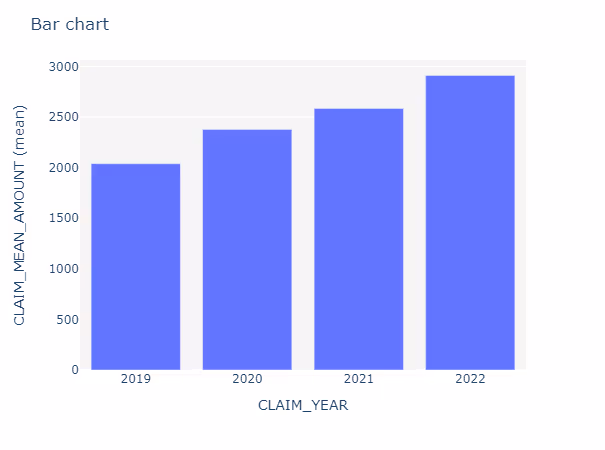
We can compare a mean response from our model with a mean target in this new dataset. This way, we will see how on average our predictions differ from observed values.
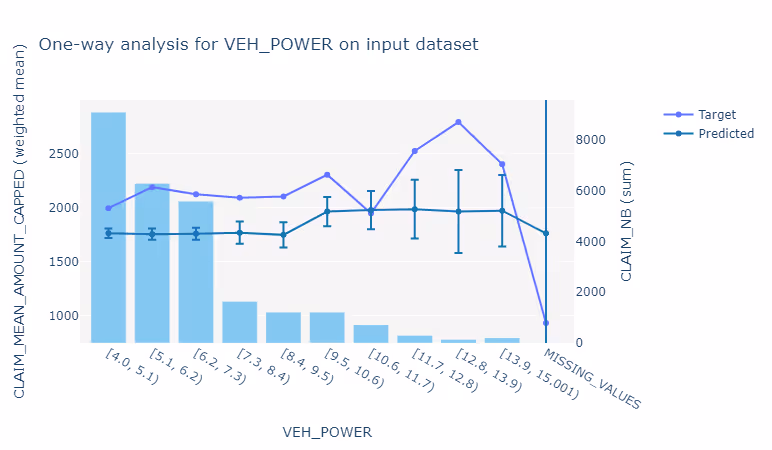
We should also check the target vs. predicted chart to see where our model diverges from observed values or the confidence interval (whiskers on the chart below). For deeper analysis, we can also use the one-way chart with predictions from the model, and also check for which segments our predictions are out of expected bounds.

We can also visualise residuals (differences between target and predicted values) on a histogram, or on a scatterplot to look for patterns. We can even build a model (maybe automatically created by pricing software) on such residuals to see which features most likely should be used in the update.
Usually, pricing actuaries recalculate their models fitting them on a similar amount of data than originally, but they move, for example, a quarter or year forward – they include more recent data and abandon the oldest ones from the initial range.
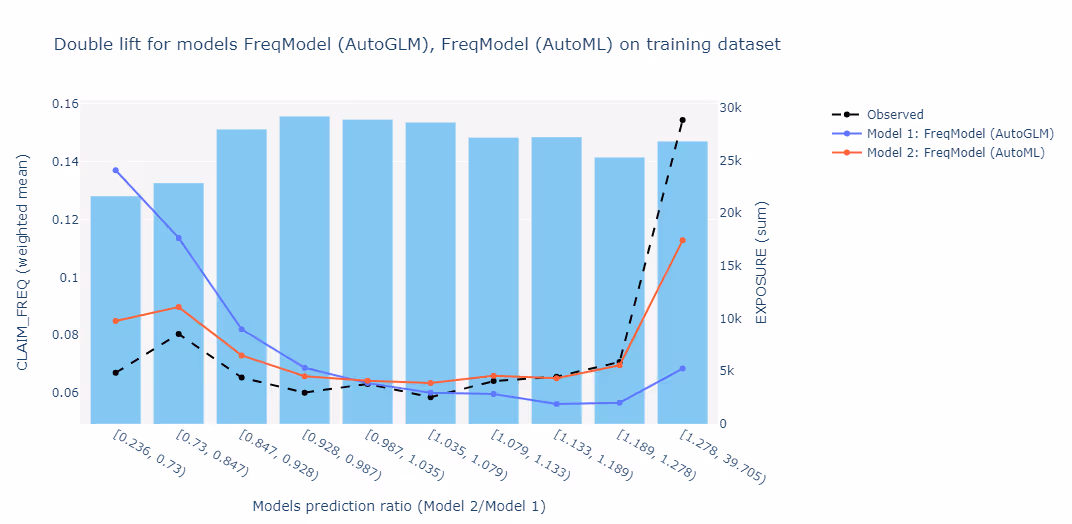
Another way is to create a completely new model for this shorter period and compare it with the current risk model. However, one should be careful not to trust too much in new data, because adjusting models to them may easily lead to overfitting. There was a reason to build your risk models first on a larger amount of data, from several years. Still, comparing features used by those models, and their relativities may bring interesting insights.
Pricing software’s versioning capabilities can help storing various versions of the same model, which is especially recommended for full auditability – to keep track of all changes in premium models used on production.
Recalculation of a model to better reflect on new data may (and should) also be automated. If not, pricing actuaries won’t have time for anything else but updating their models. The process should be structured in a way that after new data are uploaded, the whole data cleaning, processing, modelling and dashboards are recalculated with just one, or even no clicks whatsoever.
More information on how actuaries can automate the model-building process can be found in this post.
What’s also crucial in keeping premiums up-to-date?
So far in this post, we discussed the importance of keeping models up-to-date, some ideas to increase the chances that our models are stable in time, we dived into model monitoring spotting that our risk models are outdated, and we went through some ideas on how to update them.
But all the work described above is irrelevant without the possibility of quickly exposing changes in our models to sales channels. Time-to-market is crucial. It just cannot take months or even weeks to have our pricing updates implemented live if we want them to be still up-to-date. Without the agility to change pricing models or our rates on a daily basis, we will always fall behind. Pricing engines completely controlled by actuaries are necessary to reach what is called ‘real dynamic pricing’.
The best time to invest in your pricing process was yesterday, another best is now. Contact us to win the pricing race by keeping your models accurate, fair, and constantly up-to-date.
%2520(2).avif)
References